Data Analysis and Reporting
Turn Numbers into Stories
Data will not provide answers. It will, however, help to form the right questions to inform your leadership decisions.
You have a God inspired vision for your ministry, and likely a clear picture of what you would like to see happen in your local community through your church. For a lot of leaders, it is like trying to fly an airplane without a cockpit.
Growth related decisions can be difficult to make if they are made on discernment alone. By creating clear, simple, and compelling visualization from the data that you already have, Ministry Solutions Group and SmartMetrix have teamed up to help you gain clarity in where you are going, how to get there, and how to measure progress along the way.

The 153 Effect
Using over three decades of work in churches and spending a lot of time with numbers, we created the 153 Effect (we say it, “The One Five Three Effect”) to help you measure and understand what drives growth for your church.
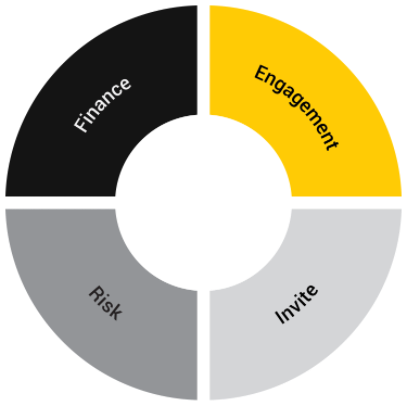
The 153 Effect is a framework to measure and assess your church’s engagement, invite, risk, and finance to ensure you have actionable data for clarity and confidenc3e in your decision making.
The 4 Benefits of Data Analysis and Reporting
Data Visualization
Discipleship and Volunteer Pathways
Predictive Analytics: What will happen next?
Converting Numbers into Stories


